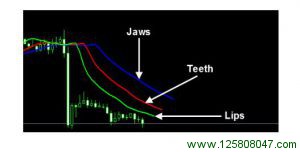
Now that we have inserted the Alligator indicator on to our charts, we can move on to inserting our next indicator which is the Relative Strength Index (RSI). On your MT4 platform, go to the top menu and click on Insert > Indicators > Oscillators > Relative Strength Index as shown on the image below: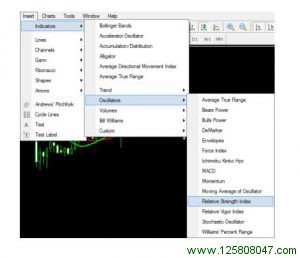
As soon as you have completed the steps above, you will be presented with the RSI indicator parameters window. The RSI indicator uses the default setting of 14 and the settings on your Parameters tab should be set as follows: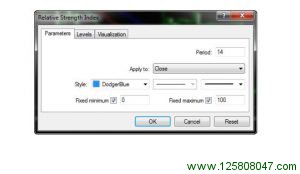
On the next tab you will find the Levels settings. There’s no need to make any changes here so make sure that your settings match the image shown below: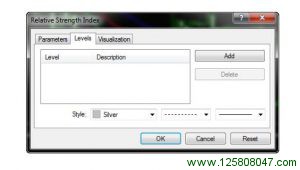
The final tab is the Visualization tab which may remain unchanged as shown on the image below. Simply click on the OK button and the RSI indicator will now be added on to your chart.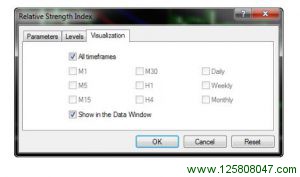
The final step is to add the Levels we will be using on the RSI. These levels can be added by simply clicking on the Horizontal line tool on the MT4 toolbar.
There are 3 horizontal lines that need to be inserted on the RSI indicator. As you can see on the image below, we will insert the lines at the 30, 50 and 70 levels: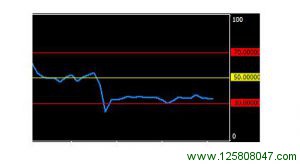
The key level that we will be monitoring when trading this system is the 50 level. If the RSI line is above the 50 level it tells us that the trend is up and if the RSI line is below the 50 level it tells us that the trend is down.
PUTTING IT ALL TOGETHER
Now that you know how to setup your charts we can take a closer look at how the different components of this system work together to produce trade signals. This system works on all currency pairs and all time frames. This system is ideal for day trading and has been found to work best on the 1 Hour time frame.
The Alligator indicator is the core of the system. This indicator determines the direction in which we will trade. The Alligator is essentially made up of three key components, the Jaw, the Teeth and the Lips.
- The Alligator’s Jaw is represented by the Blue line. This line is a 13 period Smoothed Moving Average which is shifted 8 bars into the future.
- The Alligator’s Teeth is represented by the Red line. This line is an 8 period Smoothed Moving Average which is shifted 5 bars into the future.
- The Alligator’s Lips is represented by the Green line. This line is a 5 period Smoothed Moving Average which is shifted 3 bars into the future.
As you can see on the image below, when the Alligator Lips (Green line) and Teeth (Red line) are above the Jaws (Blue line) the market is considered to be in an uptrend.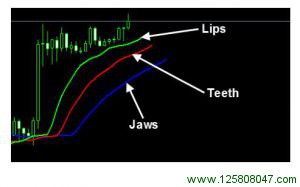
On the image above, you can see that when the Alligator Lips (Green line) and Teeth (Red line) are below the Jaws (Blue line) the market is considered to be in a downtrend.
As you can see, the Alligator indicator helps us determine the trend direction and the RSI serves to confirm the signal. On the image below you can see an example of how the RSI indicator helps confirm the trend direction we have determined using the Alligator indicator.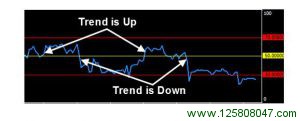
If the RSI line is above the 50 level it serves as confirmation that the market is in an upward trend. On the other hand, if the RSI is below the 50 level it serves as confirmation that the market is in a downward trend.
Now that you have a basic idea of how the Forex Trend Secrets system works, let’s take a closer look at the rules for entering Buy and Sell trades.
 峰汇在线
峰汇在线